


Have you ever watched a stock fall 20%, 30%, or even 50% and wondered if it was finally time to buy it? If that’s you, let’s talk about oversold stocks.
The stock market moves in cycles. Stocks rise, pull back, consolidate, and sometimes panic selling pushes prices far below what many traders believe is fair value. These sharp declines often create opportunities for traders and investors who understand how to identify oversold conditions correctly.
In the same way that traders use support and resistance to find entries, oversold stocks help traders identify moments where fear may have pushed prices too low too quickly.
This guide will walk through what oversold stocks are, why they matter, the indicators traders use to identify them, common mistakes beginners make, real-world examples, and a practical strategy you can begin using immediately.
Table of Contents
What Are Oversold Stocks?
An oversold stock is a stock that has experienced a significant decline in price over a relatively short period of time, often causing technical indicators to suggest that selling pressure may be exhausted.
Oversold conditions typically occur when fear, panic, bad news, earnings misses, economic uncertainty, or broader market weakness cause traders to aggressively sell shares.
However, it is important to understand that oversold does not automatically mean cheap.
A stock can become oversold for a short time while still having strong fundamentals. On the other hand, some stocks become oversold because the underlying business is falling apart. This is why traders combine technical analysis with market context before entering trades.
Oversold stocks are usually found by using technical indicators like Relative Strength Index (RSI), Bollinger Bands, moving averages, and momentum oscillators. These are tools that help traders figure out if selling pressure has become excessive.
Why Oversold Stocks Matter
Oversold stocks matter because extreme price moves rarely continue forever without some form of pullback or relief rally.
The stock market is, in fact, emotional. Why? Because it’s traded by people. When fear takes over, traders tend to sell first and ask questions later. Trading emotionally can create temporary pricing fluctuations where stocks trade significantly below their fair value.
Oversold conditions can offer several advantages, however:
- Better risk-to-reward setups
- Potential short squeeze opportunities
- Mean reversion trades
- Discounted entry prices
- Strong momentum reversal opportunities
If you want to trade professionally, you need to understand that markets overreact to news a lot. As a result, oversold stocks often become attractive trading opportunities once panic selling slows down.
This doesn’t mean every oversold stock will rebound immediately. That’s why timing, confirmation, and risk management still matter.
What Causes Stocks to Become Oversold?
Several factors can push stocks into oversold territory.
Earnings Misses
A disappointing earnings report can trigger heavy institutional selling. Even with strong companies, you’ll sometimes see them become oversold after missed expectations.
Market-Wide Selloffs
When the overall market drops sharply, quality stocks often fall with weaker companies. During market corrections and bear markets, oversold conditions become a lot more common.
Negative News
Lawsuits, government investigations, management changes, downgrades, or economic fears can trigger aggressive selling.
Sector Rotation
Institutional money constantly rotates between sectors. Sometimes entire industries become oversold when capital goes elsewhere.
Panic Selling
Fear is one of the strongest emotions in trading. Retail traders frequently panic during sharp declines. As a result, this accelerates downside momentum.
This emotional behavior creates opportunities for disciplined traders willing to wait for confirmation.
Oversold vs Undervalued Stocks
Many traders confuse oversold stocks with undervalued stocks, but they’re not the same thing.
An oversold stock is based primarily on technical analysis and short-term price movement.
An undervalued stock focuses on fundamental analysis and intrinsic value.
A stock can be:
- Oversold but not undervalued
- Undervalued but not oversold
- Both oversold and undervalued
- Neither
For example, a quality company may experience temporary panic selling after earnings. This could create both an oversold and undervalued opportunity.
Meanwhile, a struggling company with poor financials may appear oversold technically but continue falling for months.
Understanding the difference helps traders avoid dangerous setups.
How to Identify Oversold Stocks
Successful traders use multiple indicators together instead of relying on a single signal. Here are a few indicators that can help with identification.
RSI Indicator
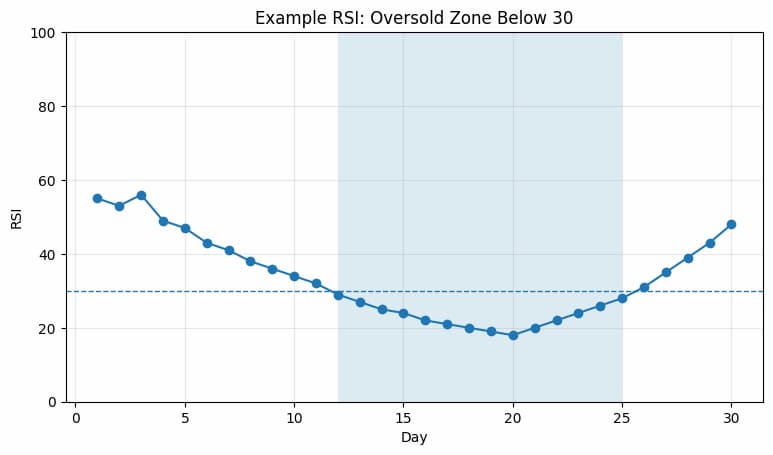
The Relative Strength Index (RSI) is one of the most popular tools for identifying oversold stocks.
The RSI measures momentum on a scale from 0 to 100.
RSI = 100 – \frac{100}{1+RS}
Generally:
- RSI below 30 suggests oversold conditions
- RSI above 70 suggests overbought conditions
An RSI below 30 does not guarantee a reversal, but it alerts traders that downside momentum may be stretched.
Many traders look for RSI divergence, where price makes new lows while RSI begins rising. This can signal weakening bearish momentum.
Moving Averages
Moving averages help traders identify how extended a stock has become.
When stocks trade significantly below key moving averages like the 20-day, 50-day, or 200-day moving average, they could be entering oversold territory.
Large gaps below these averages tend to signal emotional selling rather than rational price action.
Traders commonly watch for reclaim moves where price climbs back above a major moving average after becoming oversold.
Volume Spikes
Volume matters.
Huge spikes in selling volume can indicate capitulation, which occurs when traders panic and dump shares aggressively.
Capitulation often marks the final stage of a selloff.
Many reversal traders wait for:
- Heavy downside volume
- A strong bounce candle
- Increased buying volume
- Failed breakdown attempts
These signals can indicate that institutional buyers are stepping in.
MACD
The Moving Average Convergence Divergence (MACD) helps traders find shifts in momentum.
If the price continues falling but the MACD begins rising, a bullish divergence could be developing.
This suggests downside momentum is slowing.
That’s why traders use MACD divergence with RSI and support zones to improve their accuracy.
Process for Finding Oversold Stocks
A structured process can help traders consistently identify quality setups.
Screen for Big Declines
Start by looking for stocks that have gone down a lot recently.
Many traders scan for:
- Stocks down 10% or more in a week
- Stocks down 20% or more from highs
- Stocks with RSI below 30
- High relative volume movers
Analyze the Reason for the Drop
Understanding why a stock fell is critical.
Was it:
- Bad earnings?
- Temporary news?
- Market-wide panic?
- Weak fundamentals?
- Sector weakness?
Strong companies experiencing temporary fear often create better opportunities than fundamentally weak companies.
Look for Support
Support zones help traders identify areas where buyers may return.
These areas often include:
- Previous breakout levels
- Moving averages
- Trendlines
- Psychological price levels
- Gap fills
Wait for Confirmation
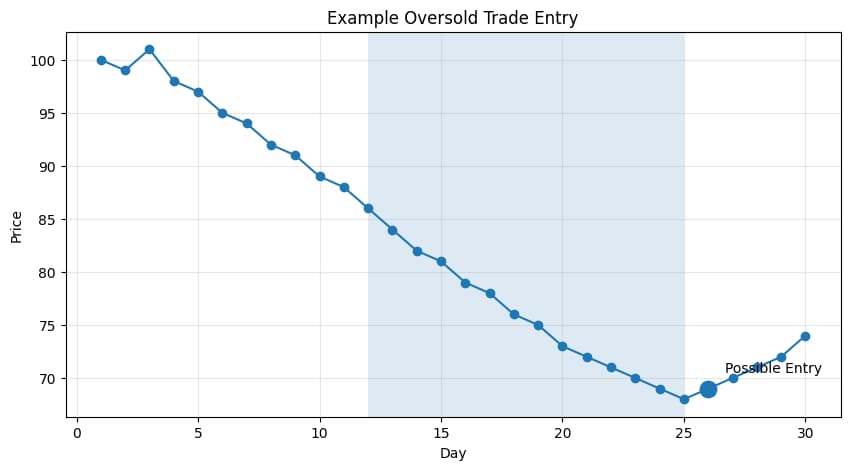
Catching the exact bottom is extremely difficult.
Instead of guessing, experienced traders wait for confirmation such as:
- Bullish engulfing candles
- Higher lows
- Increased buying volume
- Trend reversals
- Breakouts above resistance
Patience reduces unnecessary losses.
Real Examples of Oversold Stocks
Oversold opportunities appear regularly across the market.
Meta Platforms (META)
In 2022, Meta experienced one of the largest drawdowns among major technology companies. Concerns about advertising revenue, metaverse spending, and slowing growth caused massive selling pressure.
The stock became deeply oversold as fear dominated headlines.
However, once sentiment shifted and earnings stabilized, the stock staged a powerful recovery.
Netflix (NFLX)
Netflix saw heavy selling after subscriber growth slowed dramatically.
The market reacted aggressively, pushing shares into oversold territory.
Once the company adapted its business model and improved profitability, momentum returned.
Nvidia (NVDA)
Even leading growth stocks experience oversold periods during corrections.
Nvidia has repeatedly seen sharp pullbacks when the tech sector starts selling off. And then it recovers when institutional buying comes back in.
These examples demonstrate why context matters more than blindly buying every dip.
Best Sectors for Oversold Opportunities
There are certain sectors that tend to produce strong oversold reversals more frequently.
Technology
Tech stocks are highly momentum-driven. Sharp selloffs can create major bounce opportunities.
Biotechnology
Biotech stocks often experience overblown moves when FDA news or trial results come in.
Semiconductor Stocks
Chip stocks tend to move pretty aggressively during market cycles.
Small-Cap Growth
Small-cap stocks, or penny stocks, can become extremely oversold when traders or investors start trading scared.
Banking fears and interest rate concerns often create temporary oversold setups.
Traders always need to consider overall market conditions before entering sector trades.
Swing Trading Oversold Stocks
Swing traders frequently target oversold stocks because they offer strong short-term momentum opportunities.
A typical oversold swing trade could last:
- A few days
- One to three weeks
- Until resistance levels are reached
Swing traders tend to focus on:
- Daily chart setups
- RSI reversals
- Gap fills
- Oversold bounces
- Volume confirmation
Risk management remains absolutely essential because not all oversold stocks rebound immediately.
Common Mistakes to Avoid
Oversold trading can be profitable, but beginners often make several costly mistakes.
Buying Too Early
Just because a stock looks oversold doesn’t mean it can’t continue to fall. That’s why a lot of traders lose money. Because they’re attempting to predict exact bottoms.
Waiting for confirmation improves probabilities.
Ignoring Fundamentals
Technical analysis alone is not enough.
If a company has major financial problems, oversold conditions may simply reflect deeper issues.
Averaging Down Aggressively
Adding repeatedly to losing positions without a plan can become dangerous quickly.
Oversold stocks can sometimes continue to fall a lot longer than expected.
Ignoring Market Conditions
Even strong setups can fail during broad market weakness.
Always monitor:
Market direction influences nearly every stock.
Chasing Dead Cat Bounces
Not every bounce becomes a true reversal.
Some oversold stocks experience temporary rallies before continuing lower.
This is why confirmation and proper stop losses matter.
Oversold Stocks vs Falling Knives
A falling knife is a stock experiencing aggressive downside momentum with no clear support or reversal confirmation.
Oversold stocks can sometimes become falling knives if you enter too early.
The key difference is confirmation and knowing the difference between the two.
Falling knives typically show:
- No support
- No bullish divergence
- Heavy selling that continues
- Weak fundamental analysis
- Failed bounce attempts
Oversold reversal setups usually show:
- Price action is becoming stable.
- Volume improving
- Bullish divergence
- Support holding
- Momentum shifts
Understanding the difference between the two can help traders avoid unnecessary losses.
Simple Strategy for Trading Oversold Stocks
Here is a basic framework many traders use.
Find Stocks With RSI Below 30
You can use scanners to find heavily sold stocks.
Look for Major Support
Identify historical support zones or moving averages.
Wait for a Reversal Candle
Watch for bullish engulfing candles, hammers, or strong green closes.
Volume Confirmation
The increasing buying volume helps validate reversals.
Risk Management
You should always define entry, stop loss, profit target, and position size. Risk management matters more than predicting where a stock will end up. Many traders risk only 1% to 2% of their account per trade.
Where Smart Money Looks
Institutional traders often look for oversold opportunities during periods where there’s a lot of fear. Professional traders understand that emotional selling can temporarily disconnect price from reality.
However, smart money doesn’t buy blindly.
Smart money focuses on:
- Liquidity
- Relative strength
- Earnings
- Sector leadership
- Market conditions
- Technical confirmation
As a result, this is a disciplined approach that separates professional trading from emotional speculation.
Markets constantly rotate between optimism and fear. Traders who understand these cycles can identify opportunities before sentiment shifts back bullish.
Bottom Line
Oversold stocks can create excellent trading opportunities if you approach them with discipline and patience. The key to this is understanding that oversold doesn’t automatically mean buy the stock.
Successful traders combine technical indicators, market context, support levels, volume analysis, and confirmation signals before entering positions.
Fear often creates opportunity in the market, but proper risk management is what keeps traders in the game long enough to capitalize on it.
Whether you are swing trading, day trading, or building long-term positions, understanding oversold conditions can help you identify high-probability setups and avoid emotional decisions.
The market will always produce oversold opportunities. The traders who succeed are the ones who remain patient, disciplined, and focused on probability instead of emotion.
Frequently Asked Questions
Oversold means the stock’s price has fallen fast with excessive selling pressure. This is usually because of bad news and panic selling.
Not always. Oversold stocks can continue falling. Wait for confirmation before entering trades.
A stock is considered oversold if the RSI is below 30.
Oversold is tyocally when traders take bullish positions because panic selling should start to reverse.


