

Do you use a dilution tracker? If you’ve spent any time trading small-cap stocks, you’ve probably heard the term dilution thrown around in warning. One day, a stock is ripping higher, and the next it collapses 20–30% out of nowhere.
What happened?
In many cases, the answer is simple: share dilution.
And if you’re not tracking it, you’re trading blind.
That’s where dilution trackers come in. These tools have quietly become one of the most powerful advantages for retail traders looking to stay ahead of the market, especially in volatile, low-float names.
In this guide, we’ll break down exactly what a dilution tracker is, how it works, and how you can use it to protect your portfolio and even find new trading opportunities.
Table of Contents
What Is a Dilution Tracker?
A dilution tracker is a platform that analyzes SEC filings and identifies potential or active share dilution events before they hit the stock price.
It helps traders understand whether a company can issue more shares, whether it is running out of cash, and whether an offering is likely soon.
Instead of digging through filings like 10-Ks, 8-Ks, and S-1s, a dilution tracker simplifies everything into one easy-to-read dashboard.
Why Dilution Matters
Here’s the truth: most beginner traders learn the hard way. Dilution is one of the fastest ways to lose money in stocks.
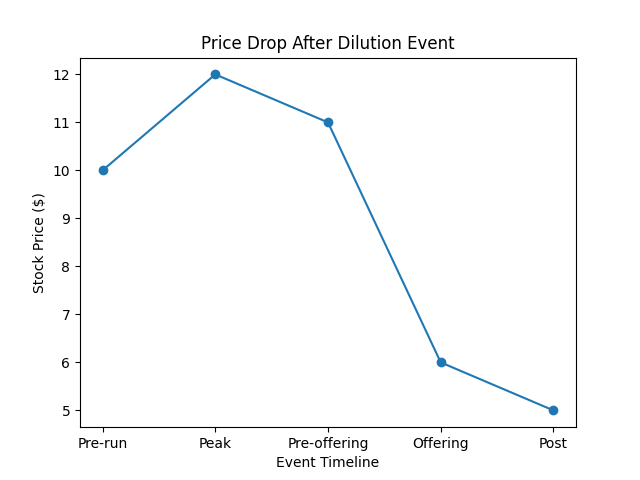
When companies issue new shares, the overall supply increases, demand becomes diluted, and the stock price usually drops as a result.
For example, if a company increases its amount of shares from 50 million shares to 60 million, that represents a 20% increase in supply. In small-cap stocks, this kind of increase often leads to sharp and sometimes immediate sell-offs.
Real Stock Example: Mullen Automotive (MULN)
There are few stocks that highlight dilution risk better than MULN.
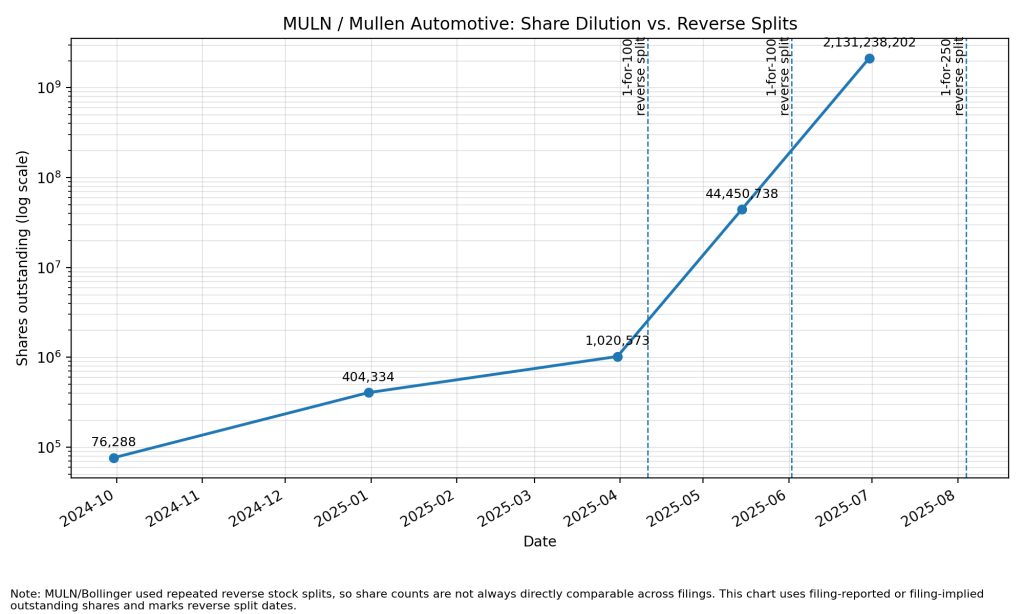
Over time, the company repeatedly raised capital through offerings, reverse splits, and continuous share issuance, which led to significant long-term downside for shareholders.
A lot of traders overlooked the warning signs. There were signs like ongoing capital raises, a weak cash flow, and a dilution cycle that kept repeating itself. If you had a dilution tracker, it would have clearly shown you the persistent dilution pressure, an increasing share count, and a high probability of future offerings.
This is a textbook example of why tracking dilution matters.
How a Dilution Tracker Works
A good dilution tracker scans SEC filings and translates complex financial data into actionable insights.
Shelf registrations allow companies to raise money in the future, essentially giving them permission to dilute shares at any time. ATM offerings, or at-the-market offerings, enable companies to sell shares gradually into the market, which creates ongoing selling pressure without major announcements.
Warrants give investors the right to buy shares at a fixed price. And when those investors exercise those warrants, they increase the total share count and add selling pressure. Convertible notes act as debt that can later be converted into shares. This often results in significant dilution, especially in penny stocks.
Cash runway is another critical factor, as it measures how long a company can survive without raising additional capital. A short runway strongly suggests that dilution is likely in the near future.
Real-World Dilution Pattern
Many traders repeatedly fall into the same predictable pattern. A stock begins to run because of hype or low floats, volume surges, and momentum building. Shortly after, the company files an offering, and the stock drops anywhere from 20% to 50%.
This cycle is extremely common in penny stocks and is one of the main reasons traders lose money.
Key Features in a Dilution Tracker
A high-quality dilution tracker should provide real-time alerts so traders can react immediately when new filings are released. It should also include dilution risk scores that offer a quick snapshot of how risky a stock may be.
Additionally, a strong platform will break down share structure clearly by showing float, outstanding shares, and fully diluted share counts. It should also include cash burn analysis to help predict when a company may need to raise capital.
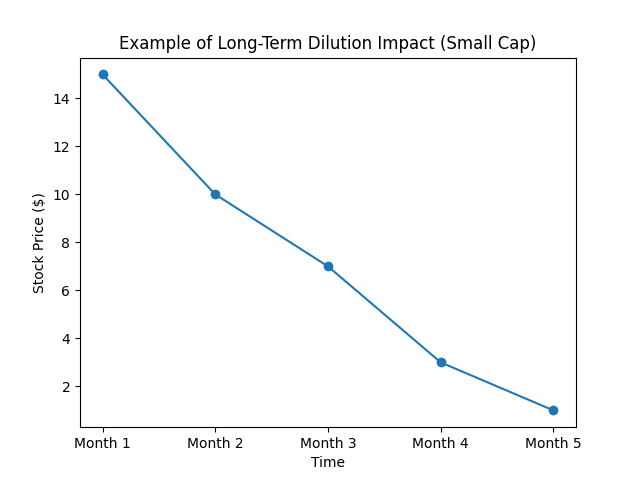
Historical dilution data is equally important because it allows traders to see how a stock has reacted to past offerings and whether it follows a repeat dilution pattern.
Who Uses Dilution Trackers?
Dilution trackers are widely used across different types of traders. Day traders rely on them to avoid sudden price drops caused by offerings, while swing traders use them to better manage risk in volatile setups.
Short sellers often use dilution trackers to find weak companies that are likely to issue shares. Then long-term investors use them to avoid businesses that consistently destroy shareholder value through repeated dilution.
Biggest Mistakes Traders Make
One of the most common mistakes traders make is completely ignoring the SEC filings. Did you know that these filings contain important information that can affect stock prices? Another mistake we can make is trusting the reported float numbers without considering warrants, convertible securities, and pending dilution.
Many traders chase momentum blindly. Failing to realize that a stock can appear strong right before a dilution event causes a sharp decline. We’ve all been guilty of that.
Is Dilution Always Bad?
Dilution is not always negative. In some cases, companies issue shares to fund growth, expand operations, or pay down debt. When used strategically, dilution can create long-term value.
However, there is a clear difference between healthy and unhealthy dilution. Strategic dilution supports growth. And survival-based dilution is often a red flag that a company is struggling to stay afloat.
How to Use a Dilution Tracker in Your Strategy
Before entering any trade, make sure to evaluate dilution risk so you better understand the company’s share structure. Monitoring cash runway is also essential, as companies with less than six to nine months of cash are more likely to raise capital.
Traders should consistently monitor new filings because they introduce new risks, and they should avoid stocks that repeatedly go through dilution cycles. In some cases, high dilution risk combined with weak fundamentals can even present short-selling opportunities.
Pros and Cons of Dilution Trackers
Dilution trackers offer a few advantages. These include helping traders avoid sudden loss, which is always the goal. They provide deeper insight into company fundamentals, saving time on research and identifying high-risk stocks early.
However, they also come with some drawbacks. Many require a paid subscription, they can take time to learn, and they are not always perfectly predictive.
Is a Dilution Tracker Worth It?
For traders focused on small-cap stocks, a dilution tracker is not just helpful but essential. It functions as a risk management tool that provides visibility into future share supply.
Stock prices are heavily influenced by supply and demand, so understanding when new shares may enter the market gives you, as a trader, a significant advantage.
Bottom Line
A dilution tracker helps traders avoid poor setups, understand true float dynamics, and stay ahead of market-moving events. Ignoring dilution is essentially guessing, while tracking it allows for smarter, more informed trading decisions.
Frequently Asked Questions
If you love trading penny stocks, then finding an accurate and reliable one can be worth it!
It's a form of seeing how small-cap stocks are run financially and if you'll lose money quickly because of dilution.
No, it's not an illegal practice. Companies can legally do this to raise capital and fund growth.
Check the SEC filings because share dilution goes through the SEC.


